Performance Data
Hardware Benchmarks
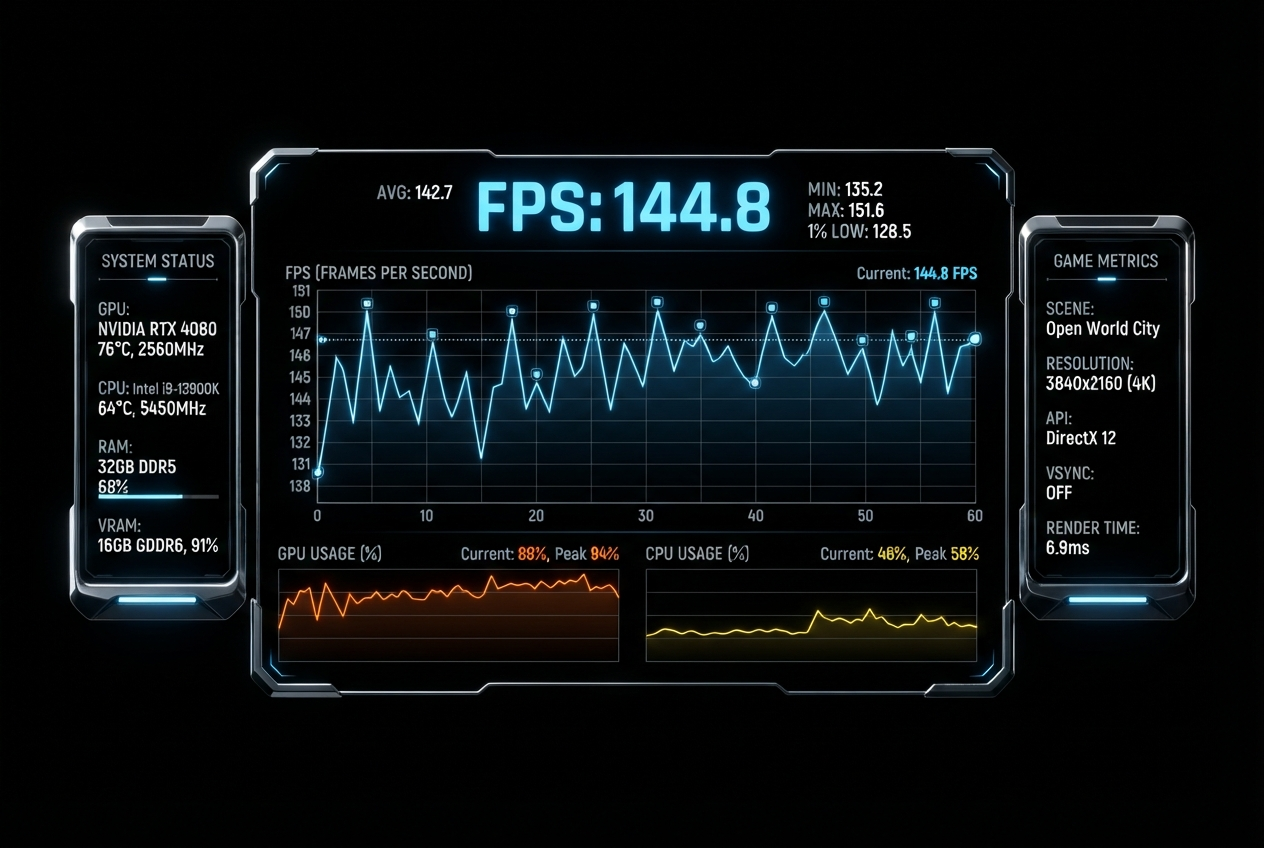
Transparent performance metrics across real-world devices. Our optimization pipeline ensures consistent 60 FPS experiences on both mobile and desktop platforms.
Across all tested devices
Initial model load (4G)
Peak mobile usage
Per frame maximum
Frame Rate Analysis
FPS Across Devices
Detailed Results
Device Specifications
| Device | FPS | Triangles | Draw Calls | Memory | Rating |
|---|---|---|---|---|---|
| iPhone 15 Pro | 60 | 2.4M | 12 | 180MB | Excellent |
| iPad Pro M2 | 60 | 4.8M | 18 | 320MB | Excellent |
| MacBook Air M3 | 60 | 8.2M | 24 | 512MB | Excellent |
| Samsung S24 Ultra | 58 | 2.1M | 11 | 195MB | Excellent |
| Pixel 8 Pro | 55 | 1.8M | 10 | 210MB | Very Good |
| Desktop RTX 4080 | 60 | 12.5M | 32 | 1.2GB | Excellent |
How We Achieve This
Optimization Pipeline
Instanced Rendering
Batch similar geometry into single draw calls, reducing GPU overhead by up to 80% for complex assemblies with repeated components.
Occlusion Culling
GPU-driven occlusion queries skip rendering of hidden geometry, maintaining high frame rates even in complex interior scenes.
Texture Atlasing
Consolidate multiple textures into single atlases to minimize state changes and maximize GPU cache efficiency.
Async Loading
Progressive mesh streaming with priority-based loading ensures smooth interaction during initial scene population.
Need Performance for Your Use Case?
We benchmark against your target devices to guarantee smooth performance.
Request Custom Benchmark